High-Tech Tools
The CyberGeologist program was created to develop computer programs that would help geologists create models of oil and gas reservoirs based on data obtained through seismic and other surveys—and from boreholes. By studying modern point bars and other sedimentary formations, scientists were able to create more accurate models based on the data collected from all the different sources.
As part of CyberGeologist, Schlumberger geologists Ian Bryant (leader of the project) and Peter Tilke looked at the many different methods used to gather and analyze data about underground rock formations in the never-ending search for oil and gas. One way the scientists gather these data is by bringing up actual samples of the rock and studying them in the laboratory, but they also use other, more sophisticated methods, such as borehole resistivity and seismic imaging.
|
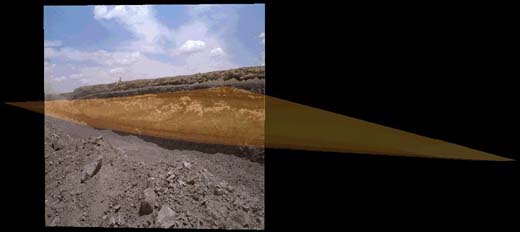
When viewed in cross section, ancient point bars have a thin lens-like shape, such as this 80-million-year-old point bar exposed in a rock quarry. Note that a 3-D model of the original formation has been overlaid on the photo. |
|
The stripes in a borehole image of rock layers indicate an underground point bar. |
Borehole resistivity images are created when a well is drilled. A special drill bit with built-in sensors is used to generate these images. As a well is drilled, the drill bit passes through the various rock layers, running an electrical current through the rock. By measuring changes in the electrical resistivity, geologists can determine what kind of rock the bit is drilling through. A computer is used to convert the information from the drill bit's measurements to a graphic image of the rock layers.
Seismic imaging uses a process similar to the sonar systems that submarines use to navigate. Scientists create vibrations in the rock. They can then measure the "echo" of the vibrations as they are reflected by the underground layers of rock.
Using these methods, scientists take a series of measurements in a selected location. Then they "connect the dots" to create a 3-D model of the underground formations. By studying modern point bars and other sedimentary formations, the scientists can create more accurate models from the borehole and seismic data they collect.
The computer programs that developed out of the CyberGeologist research program use the 3-D model to predict the location of oil and gas. These programs can also predict how oil, gas, and water will flow to the well when drilling is started and can estimate how much to expect to get out of the rocks. The CyberGeologist program created the methods currently used by almost all geologists today in the search for oil and gas.
|
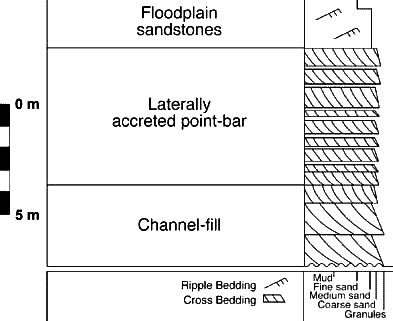
This chart describes a core of a point bar in a deep oil reservoir. |
|
Point bars modeled in a North Texas gas field on the basis of borehole and seismic images. Three point bars (pale pink) have been modeled using information from seismic data measured at the Earth's surface (blue and red) and well bore measurements (gray). The top and the bottom of the gas-bearing interval are in orange. |
This content has been re-published with permission from SEED. Copyright © 2025 Schlumberger Excellence in Education Development (SEED), Inc.


