Earthquakes and Resonance: Our Results
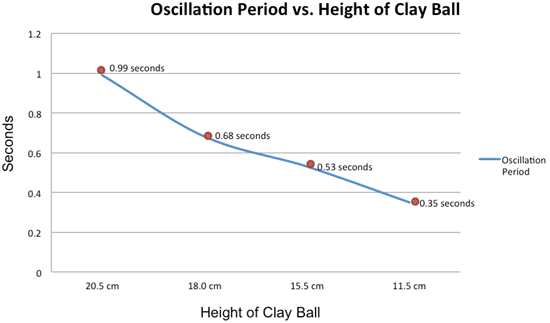
Our clay ball was set at the top of the metal strip, 20.5 cm (8.1 in) above the clamp. To determine the oscillation period, we then pulled the ball and strip to one side and let go of them. Using a stopwatch, we measured the amount of time it took for the metal strip to sway back and forth three times. We then divided the time by three and entered it into our table. We pushed the clay ball down the metal strip and repeated the procedure; we did this two more times and again measured the period of oscillation at these lower heights.
|
Height of clay ball |
Oscillation period |
|
20.5 cm |
0.99 sec |
|
18.0 cm |
0.68 sec |
|
15.5 cm |
0.53 sec |
|
11.5 cm |
0.35 sec |
Afterward, we created a graph that showed the oscillation period in seconds on the vertical axis (y-axis) and the height of the clay ball on the horizontal axis (x-axis). A plot of our data on the graph showed the oscillation period decreasing as the height of the ball decreased. Your results might not be exactly the same as ours, but the general trend should be the same.

Based on the results of this activity, we determined that the higher the clay ball was on the metal strip, the longer oscillation period it had. A tall building during an earthquake is more likely to have a longer oscillation period than if it were shorter in height, which could result in more damage during the prolonged movement if the natural oscillation of an earthquake matched that of the building. If we were to design an earthquake-resistant building, we would make sure that the natural period of oscillation of the building was far away from the dominant period of oscillation of the earthquake waves, as determined from previous earthquakes.
This content has been re-published with permission from SEED. Copyright © 2025 Schlumberger Excellence in Education Development (SEED), Inc.

