-
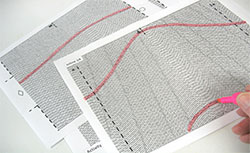
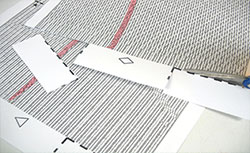
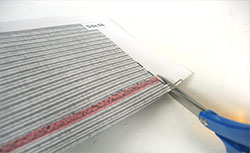
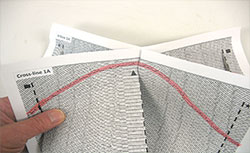
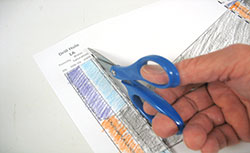
Print out the 12 seismic data pages, which have the seismic mapping information for the area of the boreholes. On each page, find one or two small layers that are denser, or thicker than the others. Geologists call these “marker beds,” because they help track the layers through various cross sections. Four of the pages will have two marker beds, and the others will have only one. Highlight the marker beds by going over them with a colored pencil, crayon, or marker.
|
-
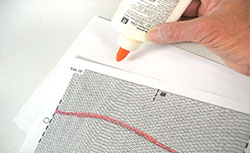
Each seismic data printout needs to be paired with its corresponding sheet in the following manner: side 1A and B, 2A and B, 3A and B, 4A and B, inline 1A and B, and cross-line 1A and B. Then glue each corresponding A and B side back-to-back, making sure that all dashed lines appear on top of each other. This will give you a total of six double-sided pages.
|
-
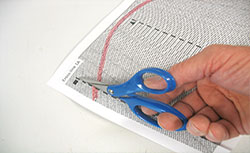
On the cross-line page, cut up from the bottom edge along the three long dashed lines, stopping about 2.5 cm (1 in) from the top.
|
-
On the Inline page, cut up from the bottom edge along the two long dashed lines, stopping about 2.5 cm from the top. Then cut down from the top edge along the short dashed line for about 2.5 cm.
|
-
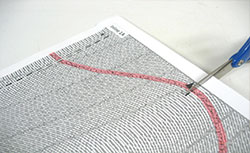
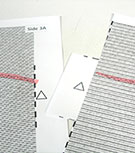
For the other four pages, form tabs on each side by cutting along the dashed lines and then out to the edges of the pages. Note that each tab has a symbol on it, for example, a circle or triangle.
|
-
For the same four pages, cut along the two short dashed lines to form slits about 7.5 cm (3 in) long. We recommend that you fold the paper to start the slit cut. Then cut down from the top edge along the short dashed line for about 2.5 cm (1 in). Note that each slit has a symbol on it, for example, a circle or triangle.
|
-
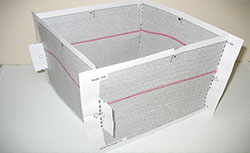
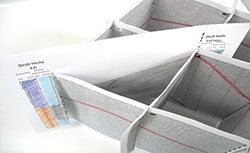
Insert the tabs of the side pages into the slits of the side pages with the corresponding symbols to form an open cube shape. The symbols on the tabs at each corner should match the symbols on the slits, and the marker beds should arch in the same direction.
|
-
Slide the cross-line page down onto the inline page to form an X. The end of the long cut in the middle of the cross-line sheet should fit into the notch of the inline page. Make sure that the marker beds all arch in the same direction. Tape the pages together at the corners.
|
-
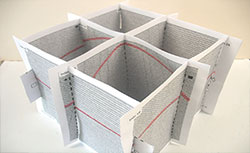
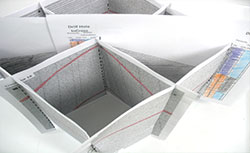
Complete your seismic cube by sliding the X made by the inline/cross-line sheets down onto the top of the open square created by sides 1–4. Make sure that the symbols on the sheets match. The long cuts of the X sheets should rest in the notches on each of the four sides of the open square. Your seismic cube should look like the one pictured.
|
-
Reinforce all corners with tape.
-
Observe your seismic cube from different directions. Note the patterns of the layers and how they change from one cross section to the other. Note particularly that the marker bed seems to rise in the central portion of the cube.
|
-
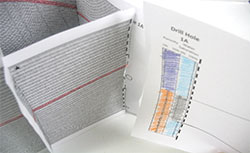
Pick up the two well log activity pages you worked on in steps 1 through 5. Drill Hole 1A corresponds to a borehole at the corner of the seismic cube where side 1 and side 4 come together. Hold the Drill Hole 1A well log next to the side 1/side 4 corner and note how the marker bed of the seismic map aligns with where the rock types change on the well log.
|
-
Drill Hole InCross corresponds to a borehole at the intersection of the two inner pages of the seismic cube, and Drill Hole 3A corresponds to a borehole at the side 2/side 3 corner of the seismic cube. Investigate how the marker beds align with the rock type changes for these two locations as well.
|
-
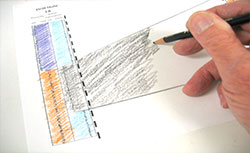
At this point, a fuller 3-D picture of the underground should be emerging for you. Can you visualize a reservoir of oil within the seismic cube? On the well log pages, fill in with black the area between the lines you have drawn. This might help you to visualize the oil reservoir.
|
-
Cut along the dashed lines on the well log pages.
|
-
Insert the 1A/InCross page into the seismic cube with Drill Hole 1A at the side 1/side 4 corner and Drill Hole InCross at the central intersection as shown.
|
-
Insert the InCross/3A page in a similar manner with the InCross well log in front of the previously placed sheet as shown.
|
|
Study your model closely from several points of view. Observe how each layer would continue through the open space to the next paper with seismic information. Visualize the 3-D space within the seismic cube that contains the oil reservoir.
When you have completed your model and analyzed it, try these questions to help you determine where to drill for oil.
- In what ways do the marker beds change from one side of the cube, through the middle, and onto the other side of the cube?
- Imagine that the marker bed was at the surface. How would you describe it? What would it look like?
- Do you see any breaks, shifts, or misalignments in the reflection layers? These could be considered “faults” or places where the rock has shifted, and the layers are no longer continuous.
- Imagine yourself going down into the seismic cube. How does the porosity change as you move down through the marker bed? How does the water saturation change?
- Which volume of the cube is likely to contain oil? Why?
- What would the rock beneath the oil reservoir be saturated with? Why?
- Where would be the best place for a production oil well? Why?
Once you have answered these questions, compare your answers with our results.
With the well log information added to the seismic data, geologists can construct a more accurate 3-D model of underground rock layers. In the real world, geologists and geophysicists use computer software to construct virtual models of below-surface layers. The CyberGeologist article explains how this works.
|


