| |
Content |
Further guidance |
Links |
| 7.1 |
- Cumulative distribution functions for both discrete and continuous distributions.
- Geometric distribution.
- Negative binomial distribution.
- Probability generating functions for discrete random variables.
- Using probability generating functions to find mean, variance and the distribution of the sum of n independent random variables.
|
 |
- Int: Also known as Pascal’s distribution.
- Aim 8: Statistical compression of data files.
|
| 7.2 |
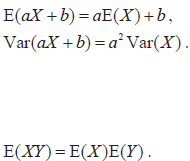
- Linear transformation of a single random variable.
- Mean of linear combinations of n random variables.
- Variance of linear combinations of n independent random variables.
- Expectation of the product of independent random variables.
|
 |
. |
| 7.3 |
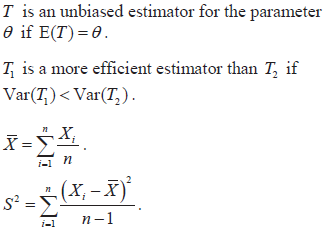
- Unbiased estimators and estimates.
- Comparison of unbiased estimators based on variances.
 as an unbiased estimator for as an unbiased estimator for  . .- S2 as an unbiased estimator for
 . .
|
 |
- TOK: Mathematics and the world. In the absence of knowing the value of a parameter, will an unbiased estimator always be better than a biased one?
|
| 7.4 |
A linear combination of independent normal random variables is normally distributed. In particular,
 The central limit theorem. The central limit theorem.
|
. |
- Aim 8/TOK: Mathematics and the world. “Without the central limit theorem, there could be no statistics of any value within the human sciences.”
- TOK: Nature of mathematics. The central limit theorem can be proved mathematically (formalism), but its truth can be confirmed by its applications (empiricism).
|
| 7.5 |
Confidence intervals for the mean of a normal population. |
Use of the normal distribution when is known and use of the t-distribution when is unknown, regardless of sample size. The case of matched pairs is to be treated as an example of a single sample technique. |
- TOK: Mathematics and the world. Claiming brand A is “better” on average than brand B can mean very little if there is a large overlap between the confidence intervals of the two means.
- Appl: Geography.
|
| 7.6 |
- Null and alternative hypotheses,Ho and H1. Significance level.
- Critical regions, critical values, p-values, one- tailed and two-tailed tests.
- Type I and II errors, including calculations of their probabilities.
- Testing hypotheses for the mean of a normal population.
|
Use of the normal distribution when σ is known and use of the t-distribution when σ is unknown, regardless of sample size. The case of matched pairs is to be treated as an example of a single sample technique. |
- TOK: Mathematics and the world. In practical terms, is saying that a result is significant the same as saying that it is true?
- TOK: Mathematics and the world. Does the ability to test only certain parameters in a population affect the way knowledge claims in the human sciences are valued?
- Appl: When is it more important not to make a Type I error and when is it more important not to make a Type II error?
|
| 7.7 |
- Introduction to bivariate distributions.
- Covariance and (population) product moment correlation coefficient ρ.
- Proof that ρ = 0 in the case of independence and ±1 in the case of a linear relationship between X and Y.
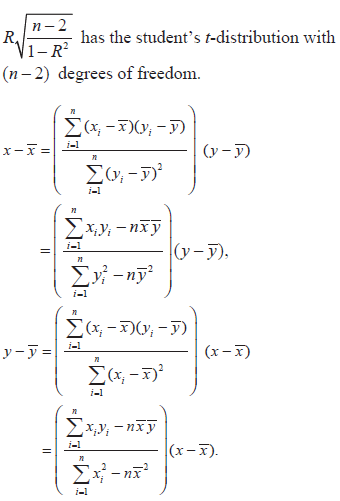
- Definition of the (sample) product moment correlation coefficient R in terms of n paired observations on X and Y. Its application to the estimation of ρ.
- Informal interpretation of r, the observed value of R. Scatter diagrams.
- The following topics are based on the assumption of bivariate normality.
- Use of the t-statistic to test the null hypothesis
- Knowledge of the facts that the regression of are linear.
- Least-squares estimates of these regression lines (proof not required).
- The use of these regression lines to predict the value of one of the variables given the value of the other.
|
- Informal discussion of commonly occurring situations, eg marks in pure mathematics and statistics exams taken by a class of students, salary and age of teachers in a certain school. The need for a measure of association between the variables and the possibility of predicting the value of one of the variables given the value of the other variable.
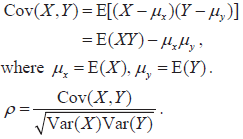 - The use of ρ as a measure of association between X and Y, with values near 0 indicating a weak association and values near +1 or near –1 indicating a strong association.
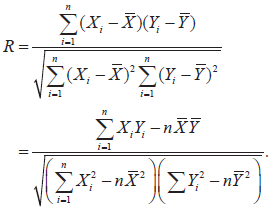 - Values of r near 0 indicate a weak association between X and Y, and values near 1 indicate a strong association.
- It is expected that the GDC will be used wherever possible in the following work.
|
- Appl: Geographic skills.
- Aim 8: The correlation between smoking and lung cancer was “discovered” using mathematics. Science had to justify the cause.
- Appl: Using technology to fit a range of curves to a set of data.
- TOK: Mathematics and the world. Given that a set of data may be approximately fitted by a range of curves, where would we seek for knowledge of which equation is the “true” model?
- Aim 8: The physicist Frank Oppenheimer wrote: “Prediction is dependent only on the assumption that observed patterns will be repeated.” This is the danger of extrapolation. There are many examples of its failure in the past, eg share prices, the spread of disease, climate change.
|


 as an unbiased estimator for
  .
. .
. The central limit theorem.

