NMR Data – Well Log
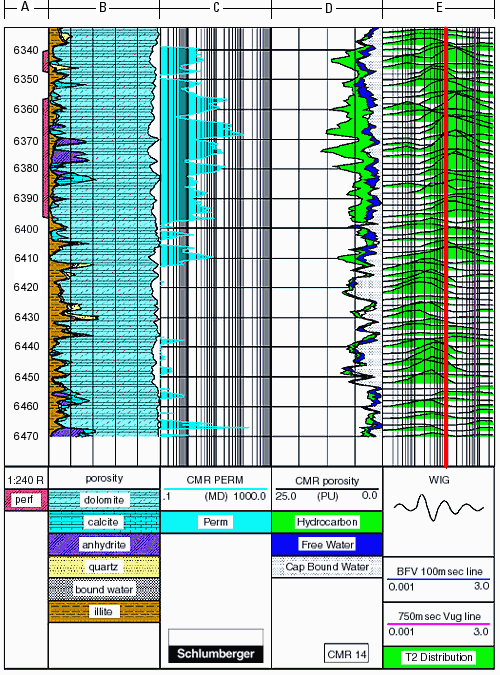
Our borehole NMR apparatus is presently deployed worldwide, helping to characterize oil and gas reservoirs. The output of the NMR instrument is a well log, which records processed data as a function of depth. A portion of a typical well log is shown below. Each panel of this well log represents different types of measurements taken by downhole tools. The depth scale (in feet) is at the extreme left in column A. In the right hand panel – column E – there is a small graph at each depth. This graph illustrates the distribution of pore sizes, as deduced from the NMR measurements. Below 6410 feet almost all the weight in the distributions is in small pores, as shown by a green peak to the left of the red line. Above 6410 feet the weight is predominantly in large pores, shown by a green peak to the right, indicating a coarse-grained formation. Thus a geologist can look at the NMR data and immediately recognize a change in rock texture at an unconformity in a formation more than a mile underground.

A log of NMR-derived fluid permeability is shown in the third panel from the left – column C. The permeability changes by orders of magnitude in this section. In the fine-grained formation the permeability is negligible, while in the upper coarse-grained section it is substantial. These results were used by petroleum engineers to institute an efficient production program for this well.
The applications of NMR to oilfield characterization go far beyond the example shown here. In fact the data is being used in ways never anticipated by those of us who designed the instrument. Borehole NMR is a good, but hardly unique, example of how the handiwork of physicists can be used by practitioners of completely unrelated disciplines, in ways that surprise all concerned.
This content has been re-published with permission from SEED. Copyright © 2025 Schlumberger Excellence in Education Development (SEED), Inc.

