Hootsgo
Published on Hootsgo (https://hootsgo.org)


Climate Change Evidence: Pollen in Core Samples

This activity created in partnership with AGI [1].

The Earth has two types of climate. There is regional climate, which depends on latitude, elevation, and geographic features. The entire planet also has a global climate, which is usually expressed as the year-round average temperature of the entire surface of the Earth. In 2013, the average temperature on the surface of the Earth was about 15°C (59°F). The current global climate has held steady in this range for several thousand years, but it has changed greatly through the billions of years that constitute geologic time.


Northern temperatures
Graph based on data reported by Moberg, et.al., in Nature [2], V. 433, 10 February 2005.


Global temperature
Graph based on data from the Climatic Research Unit [3] of the University of East Anglia.

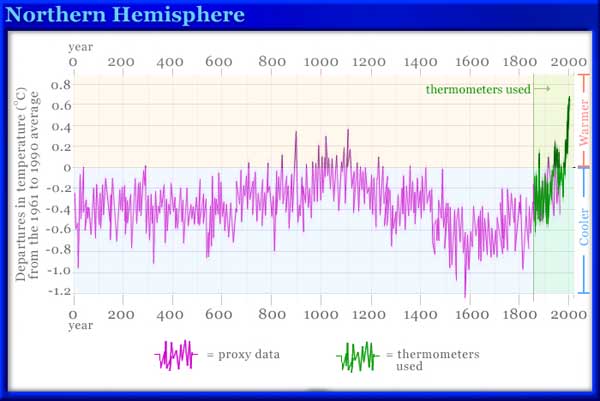
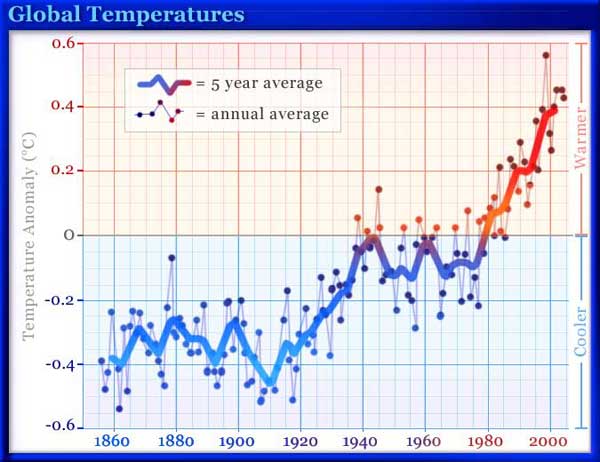
Throughout the past 1.6 million years, the Earth experienced more than 20 cycles of cooling and warming. During cool periods, average global temperatures decreased by an estimated 10°C (21°F). The timing of these cycles has varied, with low temperature extremes occurring every 100,000 years over the past million years, and every 20,000 to 40,000 years before that. In addition, there seem to have been at least three other periods of cooling and warming cycles, at about 2 billion, 600 million, and 250 million years ago.

How do scientists know what Earth’s climate was like 100 million, 100,000, or even 20,000 years ago? Historical records of temperature and weather have been kept on a regular basis for only a few centuries. To study and infer ancient climates, scientists use indirect evidence preserved in records, such as tree rings, glacier samples, seafloor sediments, and ancient rock strata. You can find out more about the different sources of information that scientists use to learn about ancient climates in the “Proxy Data Provides Clues” section of the Global Climate Change and Energy article.

One form of evidence that is particularly useful in reconstructing past climate conditions is fossilized pollen trapped in lake-bottom sediments. Certain plants, including trees, weeds, and grasses, release pollen, microscopic particles that contain the male reproductive cells of plants. Pollen particles have resistant outer cases and are produced in the millions. This means that they can be covered by sediment quickly and are easily preserved as fossils. Each plant has different-shaped pollen. Additionally, different plants are adapted to different climates. The pollen present in a layer of rock or sediment is, therefore, a good indication of the climate that existed when that pollen was deposited.

Differently shaped pollen

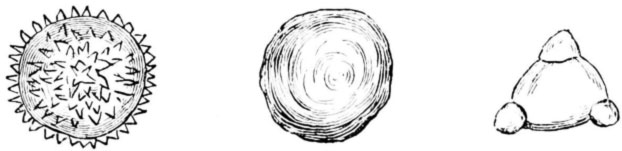
Different plants produce differently shaped pollen, as shown here. This allows scientist to identify what type of plant the pollen originated from.

Our Experiment

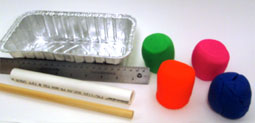
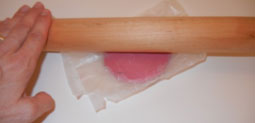
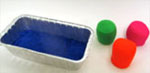
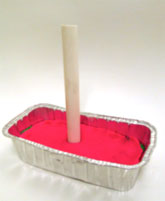
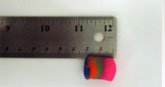
In this activity, you will use modeling clay to create a model of sediments and pollen deposited in a lake or pond over time. Various colors of clay will represent layers containing different types of pollen. You will take a core sample from your model and use a key to determine the types of pollen found in the clay. This will allow you to describe how climate has changed near the lake over time, as represented by the core sample.

Tools and materials

Tools and materials

  • Modeling clay in four different colors
  • Small, shallow, opaque dish, approximately 15 cm by 10 cm by 6 cm (6 in by 4 in by 2.5 in)
  • Plastic or metal pipe with a 2-cm (0.8-in) diameter, approximately 15 cm (6 in) in length
  • Wooden dowel or stick that fits inside the pipe and is longer than the pipe
  • Ruler
  • Waxed paper (optional)
  • Rolling pin (optional)
  • Paper ball or piece of rag that fits snugly into the plastic or metal pipe (optional)

What to do

  1. Assign particular types of pollen categories to each of your colors of clay and set up a chart to use as a key. For example, we used pink, green, orange, and blue clay and set up our key in the chart below.

    Clay color

    Types of pollen in sediments

    Pink

    mostly spruce and alder pollen, with a little oak and grass pollen

    Green

    pollen from cold-climate plants, such as spruce and alder trees

    Orange

    mostly oak and grass pollen, with a little spruce and alder pollen

    Blue

    pollen from warm-climate plants, such as oak trees and grasses

  1. Step 2

    Create your model of a lake bottom by putting your clay into the container in four layers. You may put the colors down in any order and thickness. We recommend flattening the clay before you put it in the container, with your hand or between sheets of waxed paper. You can roll it with a kitchen rolling pin, if you have one available.

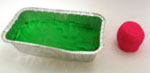
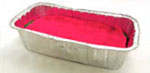
As you place the layers of clay in the container, keep in mind that the layers on the bottom represent the oldest layers of sediment. This is called the law of superposition—scientists use this principle when figuring out the relative ages of underground layers.

Step 2b Step 2c Step 2c Step 2d
Step 3


  1. Next, use the small plastic or metal pipe to take a core sample. Push the pipe straight down through all of the layers. It is helpful to turn the pipe as it is going through all of the layers and to push hard against the bottom of the container.

     
    Once you have hit bottom, carefully pull the pipe back up. The clay should stick to the inside of the pipe when you pull it up. If your clay sample did not stick, move to a new area of the clay and try again while twisting the pipe as it goes down.

  1. Step 4a   Step 4b

    Use a wooden dowel or stick to gently push the core of sediment out of the pipe. If the pipe is much wider than the stick, it might be helpful to put a paper ball or rag into the pipe so that it sits on top of the clay core sample. Then, push the ball or rag and core sample out of the pipe with the stick.

  1. Step 5

    Draw a picture of the core and note which end is the top.
     

  2. Measure and record the thickness of each layer of sediment to the nearest 0.1 cm.
  1. The different colors of clay represent sediments that have settled at the bottom of the lake at various times. Using the law of superposition, we know that the bottom layer is the oldest. For this exercise, assume that each centimeter of clay represents 1,000 years of time. Now calculate answers to these questions:
    1. How many years does your core represent from top to bottom?
    2. How many years does each layer represent?
       
  2. Use your pollen key chart and the results from step 7 to answer the following questions.
    1. How do you think the pollen gets into the lake sediments?
    2. Describe what the climate around the lake was like when each layer of sediment was deposited.
    3. Write a paragraph describing how that climate changed over the period of time represented by your core. Make sure you state how many years ago each climate change occurred. Include photographs, drawings, charts, or any other representations to help others understand your findings. Note whether transitions from one type of climate to another appear to have happened slowly or quickly.

Compare your observations with our results. [4]

Related Article

  • Our Results [5]
  • Teacher's Notes [6]

This content has been re-published with permission from SEED. Copyright © 2025 Schlumberger Excellence in Education Development (SEED), Inc.

Course: 

  • Science [7]
Result/Solution(s)

Pollen from the dominant plants in a region travels through the air and falls everywhere, including into bodies of water such as lakes. There, the pollen settles to the bottom and accumulates along with the lake-bottom sediments. The climate of a region during a specific time period can be determined by the type of pollen found in those sediments, whether the pollen is from warmer-weather plants or colder-weather plants.

We used pink, green, orange, and blue modeling clay to create a model of sediments and pollen deposited in a lake or pond over time. Once our four-layer model was done, we used a small plastic or metal pipe to take a core sample by pushing the pipe straight down through all of the layers. We then pulled the pipe back up, but our sample was stuck in the pan. We tried again, in a different location in the model; by turning the pipe, we were able to successfully pull up a core sample that stayed inside the pipe. We used a wooden dowel or stick to push the core sample out of the pipe. We then measured the thickness of each layer of sediment in the sample. Our measurements were as follows:

Layer

Color

Thickness

Layer 1 (top)

pink

0.8 cm

Layer 2

green

0.3 cm

Layer 3

orange

0.7 cm

Layer 4 (bottom)

blue

0.2 cm

Step 5

We assumed that each centimeter of clay represented 1,000 years of time. Our core sample was 2.0 cm thick. Given that 1 cm represented 1,000 years, the total time represented by our core was 2,000 years. Based on the thickness of each layer, we determined the number of years represented by each layer as follows:

Layer

Color

Thickness

Years represented

Layer 1

pink

0.8 cm

800

Layer 2

green

0.3 cm

300

Layer 3

orange

0.7 cm

700

Layer 4

blue

0.2 cm

200

Each color of clay represented a sedimentary layer containing pollen from specific plant species; the plant species indicated the type of climate during that time. Before starting the activity, we decided that the different colors of clay represented sediments containing the following types of pollen:

Clay color

Types of pollen in sediments

Pink

mostly spruce and alder pollen, with a little oak and grass pollen

Green

pollen from cold-climate plants, such as spruce and alder trees

Orange

mostly oak and grass pollen, with a little spruce and alder pollen

Blue

pollen from warm-climate plants, such as oak trees and grasses

The top of the core represented the present based on the law of superposition—the first layer deposited is the oldest and the top layer is the youngest. Based our data, we determined that the oldest layer (blue—layer 4) contained pollen from grasses and oaks, which indicated a warm climate. This layer represented a time from about 2,000 years before the present time to about 1,800 years before the present. Layer 3 (orange) represented the time period from about 1,800 years before the present to about 1,100 years before the present. In this layer pollen from oak trees and grasses was still predominant, but pollen from alder and spruce trees also was present. This indicated that the climate had cooled somewhat relative to the time when the blue layer was deposited. 

Oak and grass pollen was absent from layer 2 (green), indicating a further cooling of the climate during the period between 1,100 years before the present and 800 years before the present. The top, youngest layer (pink) mostly had pollen from the cold-climate plants (spruce and alder), but it also had a little pollen from oak trees and grasses. This implied that the climate began to warm again after 800 years before the present, with the warmer climate continuing to the present.

We created the following graph to show the approximate progress of the temperature change over 2,000 years:

progress of the temperature change over 2,000 years

  • earth science [8]
113128
Copyright © 2018 Hootsgo. All Rights Reserved. Hootsgo is a registered 501 (c) (3) non-profit organization.
Donated by Dev2Source I.T. Services Ltd.

Source URL: https://hootsgo.org/?q=climate-change-evidence-pollen-core-samples

Links
[1] http://www.americangeosciences.org/education
[2] http://www.nature.com/nature
[3] http://www.cru.uea.ac.uk/
[4] https://hootsgo.org/node/10171
[5] https://hootsgo.org/climate-change-evidence-pollen-in-core-samples-our-results
[6] https://hootsgo.org/climate-change-evidence-pollen-in-core-samples-teachers-notes
[7] https://hootsgo.org/?q=taxonomy/term/63
[8] https://hootsgo.org/?q=tags/earth-science