Hootsgo
Published on Hootsgo (https://hootsgo.org)


Seeing Underground: Mapping Below the Surface, Our Results, Part 1

Underground mapping results

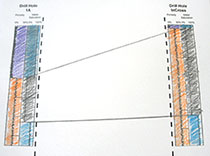
Drill Holes 1A and InCross

    Underground mapping results

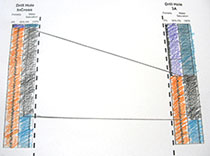
Drill Holes InCross and 3A

These photos show what our two pages looked like after we colored in the columns for porosity and water saturation, and drew the lines connecting where their values changed. Your pages should look very much like these.

The lines show how these values might change between the pairs of boreholes. Because we do not have any information about the underground layers away from the boreholes, these lines are only guesses at this point.

Related Article

  • Experiment Part 1 [1]
  • Experiment Part 2 [2]
  • Our Results, Part 1 [3]
  • Our Results, Part 2 [4]
  • Teacher's Notes [5]

This content has been re-published with permission from SEED. Copyright © 2025 Schlumberger Excellence in Education Development (SEED), Inc.

Copyright © 2018 Hootsgo. All Rights Reserved. Hootsgo is a registered 501 (c) (3) non-profit organization.
Donated by Dev2Source I.T. Services Ltd.

Source URL: https://hootsgo.org/?q=laboratory-activities/underground-mapping-results-part1

Links
[1] https://hootsgo.org/laboratory-activities/underground-mapping-experiment-part1
[2] https://hootsgo.org/laboratory-activities/underground-mapping-experiment-part2
[3] https://hootsgo.org/laboratory-activities/underground-mapping-results-part1
[4] https://hootsgo.org/laboratory-activities/underground-mapping-results-part2
[5] https://hootsgo.org/laboratory-activities/underground-mapping-teachers-notes