Climate Change Evidence: Pollen in Core Samples
This activity created in partnership with AGI.
The Earth has two types of climate. There is regional climate, which depends on latitude, elevation, and geographic features. The entire planet also has a global climate, which is usually expressed as the year-round average temperature of the entire surface of the Earth. In 2013, the average temperature on the surface of the Earth was about 15°C (59°F). The current global climate has held steady in this range for several thousand years, but it has changed greatly through the billions of years that constitute geologic time.
|
|
|
|
Throughout the past 1.6 million years, the Earth experienced more than 20 cycles of cooling and warming. During cool periods, average global temperatures decreased by an estimated 10°C (21°F). The timing of these cycles has varied, with low temperature extremes occurring every 100,000 years over the past million years, and every 20,000 to 40,000 years before that. In addition, there seem to have been at least three other periods of cooling and warming cycles, at about 2 billion, 600 million, and 250 million years ago.
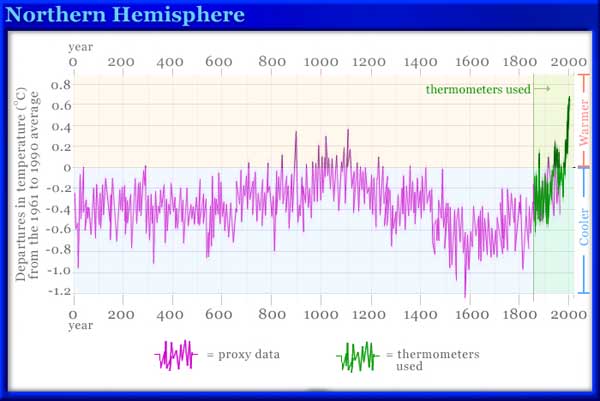
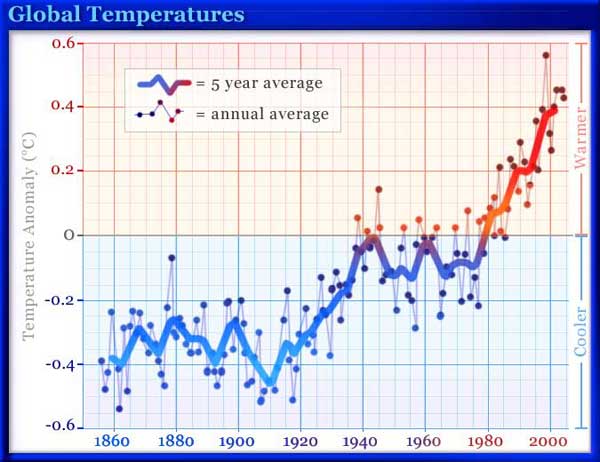
How do scientists know what Earth’s climate was like 100 million, 100,000, or even 20,000 years ago? Historical records of temperature and weather have been kept on a regular basis for only a few centuries. To study and infer ancient climates, scientists use indirect evidence preserved in records, such as tree rings, glacier samples, seafloor sediments, and ancient rock strata. You can find out more about the different sources of information that scientists use to learn about ancient climates in the “Proxy Data Provides Clues” section of the Global Climate Change and Energy article.
One form of evidence that is particularly useful in reconstructing past climate conditions is fossilized pollen trapped in lake-bottom sediments. Certain plants, including trees, weeds, and grasses, release pollen, microscopic particles that contain the male reproductive cells of plants. Pollen particles have resistant outer cases and are produced in the millions. This means that they can be covered by sediment quickly and are easily preserved as fossils. Each plant has different-shaped pollen. Additionally, different plants are adapted to different climates. The pollen present in a layer of rock or sediment is, therefore, a good indication of the climate that existed when that pollen was deposited.
 Different plants produce differently shaped pollen, as shown here. This allows scientist to identify what type of plant the pollen originated from. |
Our Experiment
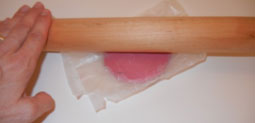
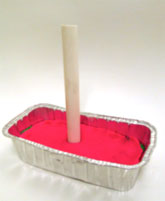
In this activity, you will use modeling clay to create a model of sediments and pollen deposited in a lake or pond over time. Various colors of clay will represent layers containing different types of pollen. You will take a core sample from your model and use a key to determine the types of pollen found in the clay. This will allow you to describe how climate has changed near the lake over time, as represented by the core sample.
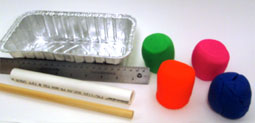 |
Tools and materials
- Modeling clay in four different colors
- Small, shallow, opaque dish, approximately 15 cm by 10 cm by 6 cm (6 in by 4 in by 2.5 in)
- Plastic or metal pipe with a 2-cm (0.8-in) diameter, approximately 15 cm (6 in) in length
- Wooden dowel or stick that fits inside the pipe and is longer than the pipe
- Ruler
- Waxed paper (optional)
- Rolling pin (optional)
- Paper ball or piece of rag that fits snugly into the plastic or metal pipe (optional)
What to do
|
|||||||||||
|
|||||||||||
|
|||||||||||
|
|||||||||||
|
|||||||||||
|
|||||||||||
|
|||||||||||
This content has been re-published with permission from SEED. Copyright © 2025 Schlumberger Excellence in Education Development (SEED), Inc.


