Seeing Underground: Mapping Below the Surface, Experiment Part 1
Our Experiment: Part 1
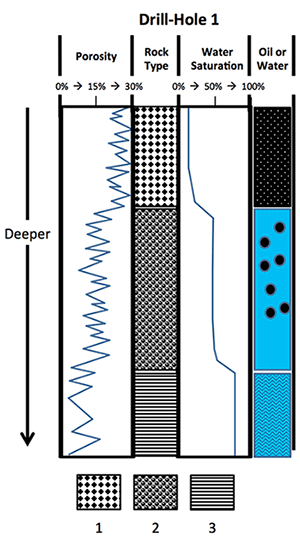
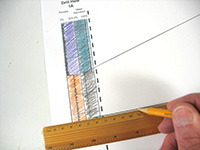
First you need to learn how to read a well log. Our sample well log, from a borehole called Drill-Hole 1, shows what a geologist would see in a log from an oil-bearing rock. The top of the diagram is at the level of the land surface, and the downward arrow shows the depth of the borehole. This log contains measurement data for porosity and water saturation. You can see how the measurements change with depth.
|
|
Porosity, shown in the far-left track on the well log, is a measure of the percentage of open space in the rock; the higher the percentage, the larger the spaces within the rock. (See our porosity activity for more information and details.) Pore space can be an indicator of the rock type. The second track, rock type, is derived from the porosity measurements and illustrates this principle. Rock type 1 has a high porosity (15–30%), while rock type 3 has a low porosity (0–15%). In this example, rock type 1 might be a sandstone and rock type 3 might be a kind of shale.
The amount of water filling the pore space in the rock, called water saturation, is also described as a percentage. This measurement is shown in the third track. The rock may be saturated with water, or oil, or a combination of the two. For example, at 50% water saturation, there may be 50% oil, shown in black. Likewise, if we see 10% water saturation, we can assume we have 90% of the pores filled with oil. Based on the water saturation, we can construct the fourth track determining if there is oil or water in the rocks.
Now it is your turn to interpret well logs and incorporate them with seismic data to create a 3-D model of the underground.
Tools and materials
What to do
|
|
|
|
|
|
|
|
|
For the next part of this activity, you will work with seismic readings.
This content has been re-published with permission from SEED. Copyright © 2025 Schlumberger Excellence in Education Development (SEED), Inc.


